Chapter 5 Forecasting
# Load necessary libraries
library(forecast)
library(tidyverse)
library(kableExtra)
# Load the data
BitCoin <- read.csv("https://raw.githubusercontent.com/shakibed/Final_Project_Group_04/main/BTC-Monthly.csv", stringsAsFactors = FALSE)

# Convert date
BitCoin$Date <- as.Date(BitCoin$Date)

# Convert to time series object
bitcoin_ts <- ts(BitCoin$Close, start = c(as.numeric(format(min(BitCoin$Date), "%Y")), as.numeric(format(min(BitCoin$Date), "%m"))), frequency = 12)
5.0.1 Explanation of the Forecast Table
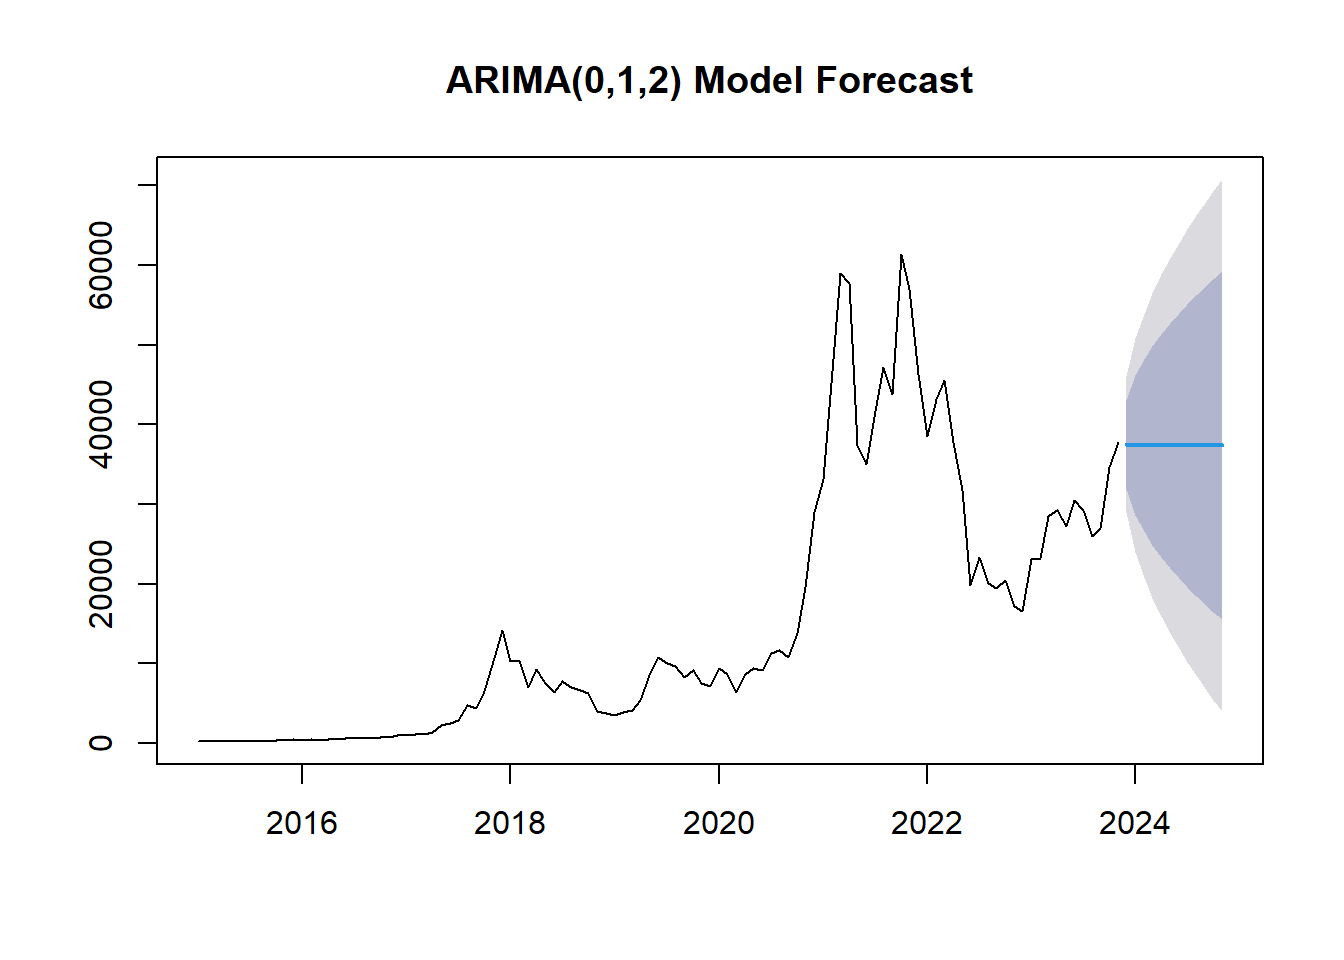
bitcoin_forecast_fit_model <- Arima(bitcoin_ts,c(0,1,2))
forecast_next_12 <- forecast(bitcoin_forecast_fit_model,h=12)
kable(forecast_next_12, digits = 2, formats="html", row.names = TRUE) %>%
kable_styling(full_width = F, font_size = 12, position = "center")| Point Forecast | Lo 80 | Hi 80 | Lo 95 | Hi 95 | |
|---|---|---|---|---|---|
| Dec 2023 | 37492.11 | 31918.44 | 43065.77 | 28967.92 | 46016.29 |
| Jan 2024 | 37363.86 | 28605.25 | 46122.46 | 23968.73 | 50758.98 |
| Feb 2024 | 37363.86 | 26564.53 | 48163.18 | 20847.71 | 53880.00 |
| Mar 2024 | 37363.86 | 24852.35 | 49875.36 | 18229.16 | 56498.55 |
| Apr 2024 | 37363.86 | 23347.79 | 51379.92 | 15928.14 | 58799.57 |
| May 2024 | 37363.86 | 21989.78 | 52737.93 | 13851.23 | 60876.48 |
| Jun 2024 | 37363.86 | 20742.35 | 53985.36 | 11943.45 | 62784.26 |
| Jul 2024 | 37363.86 | 19582.21 | 55145.50 | 10169.18 | 64558.53 |
| Aug 2024 | 37363.86 | 18493.27 | 56234.44 | 8503.78 | 66223.93 |
| Sep 2024 | 37363.86 | 17463.82 | 57263.89 | 6929.38 | 67798.33 |
| Oct 2024 | 37363.86 | 16485.07 | 58242.64 | 5432.51 | 69295.20 |
| Nov 2024 | 37363.86 | 15550.19 | 59177.52 | 4002.74 | 70724.97 |
The forecast table provides the projected Bitcoin prices for the next 12 months along with their confidence intervals. Here’s what each column represents:
-Point Forecast: This is the predicted value of the Bitcoin price for each month. It’s the best estimate based on the ARIMA(0,1,2) model. - Lo 80 and Hi 80: These columns represent the lower and upper bounds of the 80% confidence interval. There’s an 80% chance that the actual Bitcoin price will fall within this range. - Lo 95 and Hi 95: These columns represent the lower and upper bounds of the 95% confidence interval. There’s a 95% chance that the actual Bitcoin price will fall within this range.
5.1 Key Insights
- Steady Price Increase: The point forecast predicts a steady increase in Bitcoin prices from approximately $36,803 in December 2023 to $37,310 in November 2024.
- Uncertainty Range: The prediction intervals widen over time, indicating increasing uncertainty, with 95% confidence intervals ranging from around $28,451 to $45,154 in December 2023 to $2,952 to $71,669 in November 2024.
- Moderate Fluctuations: The forecasts suggest moderate monthly fluctuations, with the highest forecasted point in April 2024 and the lowest in March 2024.